(click to enlarge)
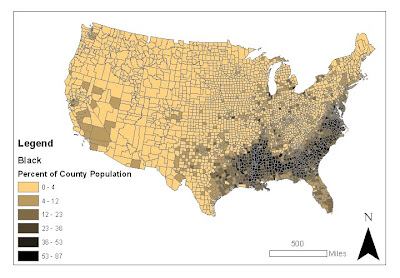
This map shows the percentage of black people living in each county in the United States in 2000. The percentage is calculated by the number of black people in a county divided by the total number of people in that county. One major pattern is that there tends to be a higher percentage of black people living in the Southern states. There is also a slightly higher percentage in California than in many of the mid-western and northern states.

(click to enlarge)
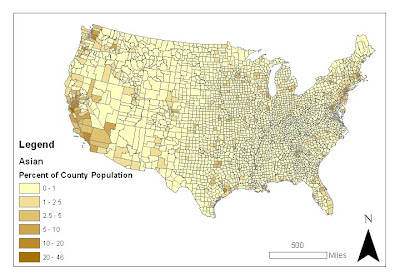
This map shows the percentage of asian people living in each county in the United States in 2000. The percentage is calculated by the number of asian people in a county divided by the total number of people in that county. One major trend is that there tends to be a higher percentage of asian people living in coastal states. California and Washington have quite high percentages, and there is also a concentration in New York and Maryland.

(click to enlarge)
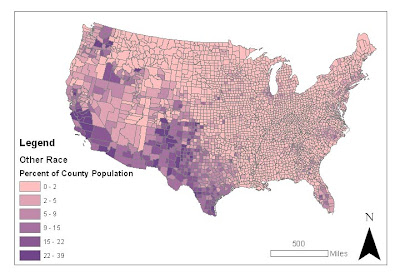
This map shows the percentage of "other race" people living in each county in the United States in 2000. The percentage is calculated by the number of "other race" people in a county divided by the total number of people in that county. A major pattern is that there tends to be a higher percentage of "other race" people living in states that border Mexico, as well as in Washington. It would make sense if "other race" includes Latinos, as it is known that there are high percentages of Hispanic and Latino Americans living in California, Texas, and New Mexico.
Concluding Discussion of Census Maps:
The census maps reveal rather clear patterns of where people of certain races tend to live. For the map of African Americans, especially, there is a clearly defined area of higher percentages of black people. I believe these maps reveal the racial segregation that occurs in the United States, either voluntarily by where people choose to live, or caused by societal pressures. If some degree of racial segregation was not occurring, these clear patterns would not emerge. Overall, the data was interesting to look at. I just hope that these patterns can be attributed to voluntary actions, and the general tendency of people within the same ethnic group to live together, rather than with those of a different ethnic group. With the differing economic success of various areas, however, it seems that there are other unfortunate factors at play.
My Overall Impressions of GIS:
GIS is obviously a powerful tool with many applications across various fields. With GIS, it is quite easy to take raw data and turn it into a clear, concise, and stylish map. I was impressed by the interface for choosing intervals for the categories and colors; it was very customizable. Since you can even make 3D graphics in ArcScene, the program seems extremely versatile. GIS can be used for spatial analysis (to get results for your study) and producing graphics (to display those results). In this way, it is a very useful device for scientists, who can complete two parts of their scientific research with one program. I'm glad I had the opportunity to work with ArcGIS, because I may use this powerful tool to conduct spatial analysis and present results in future jobs. It is quite relevant to any kind of environmental spatial analysis, such as examining which areas are impacted by pollution, finding good sites for wind-mills or solar power plants, or defining the range of endangered animals.
No comments:
Post a Comment