
Tuesday, May 31, 2011
Fauna of Palau Website
It's finally done! This was a group effort. My main contributions were building the website, formatting everything, and creating all of the graphics, as well as proof-reading and fact-checking the written portions.
Tuesday, May 3, 2011
Alternative Renewable Energy Presentation
This is actually a group project, but I can take credit for coming up with the ideas for the research topics and polishing up and putting together everyone's slides. The project is a presentation on "Alternative Renewable Energy," or forms of renewable energy other than the traditionally thought of solar, wind and water.

Click here to see the presentation on Google Docs!
Click here to see the presentation on Google Docs!
La Brea Tar Pits Research Project
I had a lot of fun writing this paper on the tar pits of La Brea for my California class. In the essay, I explore the significance and history of the tar pits, in science and popular culture past and present.

Click here to see the paper on Google Docs!
Click here to see the paper on Google Docs!
STELLA Coursework
In my Environmental Modeling class, I learned how to use STELLA software to create stock and flow models like this one, which simulates the amount of water in Mono Lake after diversion of water for use in Southern California began.
The visual structure of the model, and a graph of the results:

The equation sheet, which demonstrates how the variables are related:

The visual structure of the model, and a graph of the results:

The equation sheet, which demonstrates how the variables are related:

Friday, November 26, 2010
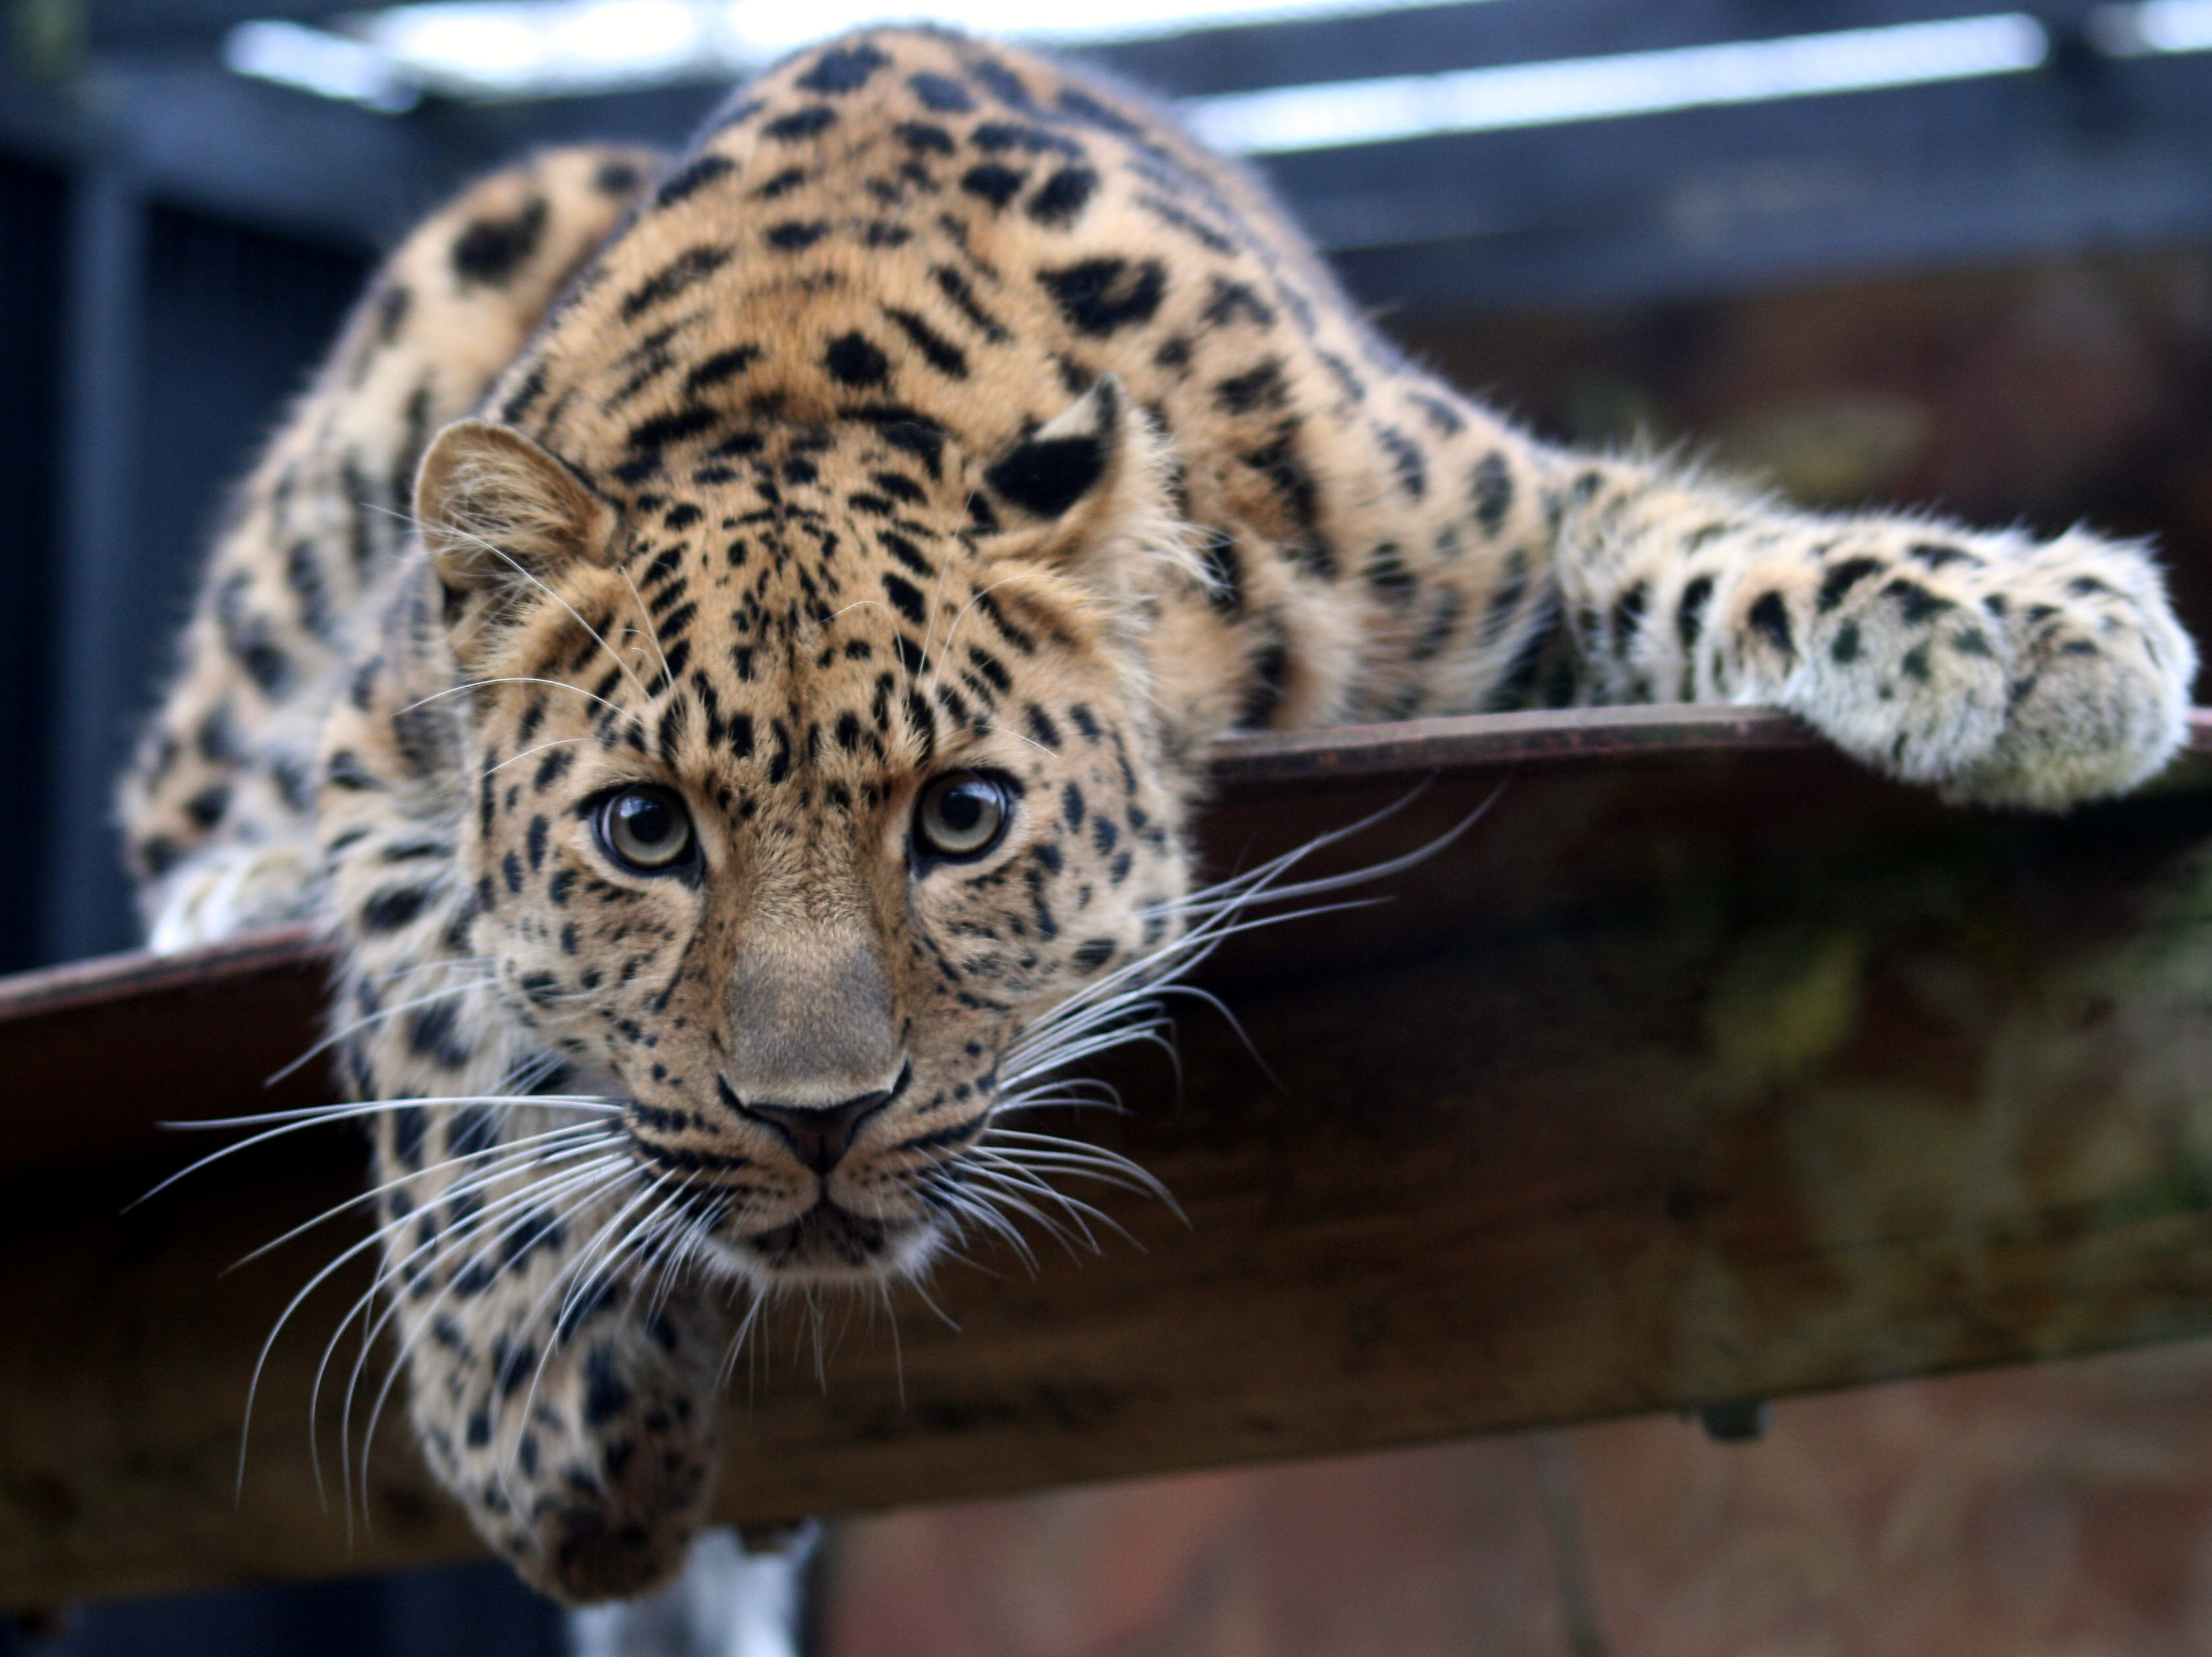
Amur Leopard Habitat Project
More Information on the Amur Leopard at Wikipedia
Conservation Information on the Amur Leopard at The Amur Leopard and Tiger Alliance Website
Abstract
The critically endangered Amur Leopard's habitat in Primorsky Krai, Russia, is being destroyed by fires. Frequent ground fires are converting the leopard's preferred habitat, dense forest, into grasslands. This study employs a comparison of Landsat images using NDVI analysis, fire data from FIRMS, SRTM data, and night light data to examine fire extent and forest loss. The images clearly show that deforestation is occurring in the area, and the fires and loss of greenness are concentrated near human settlements. This reinforces the theory that locals may be causing or encouraging fires either deliberately or indirectly by converting forests into more easily burned hayfields. Educating the locals on the importance of wildlife conservation, as well as creating fire breaks to slow the spread of fires in leopard habitat, should help conservation efforts.
Introduction
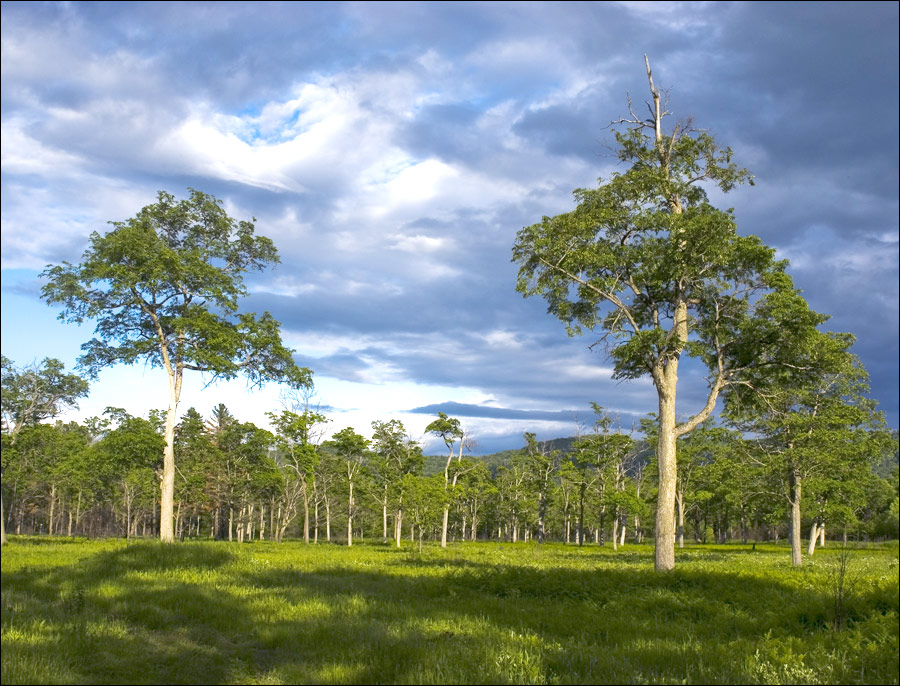
In far-eastern Russia, along the Pacific coast, is a biodiversity hotspot called Primorsky Krai (spelling variations include Primorskii, Primorskiy, and Primorye Kray). This area is home to the critically endangered Panthera pardus orientalis, also known as the Amur Leopard or Far Eastern Leopard. No more than thirty of the cats currently survive in the wild, and the small population urgently needs protection. One of the main threats to the survival of these cats, along with poaching and human development, is the destruction of their habitat by fires. Amur Leopards require dense forest habitat, but frequent fires turn the forests into grasslands. Locals are thought to encourage burning because ferns that are valuable as a cooking ingredient prosper in the open grassland environment. The most prominent research on this phenomenon was undertaken by ALTA (The Amur Leopard and Tiger Alliance). ALTA’s paper examines the extent of fires in Primorsky Krai, and finds a correlation between high fire occurrence and areas of human activity. To build upon ALTA’s research, additional analyses of satellite images were conducted. The intent is to determine the extent to which the fires have damaged the landscape, and the loss of tree-cover in the Primorsky Krai area.
Methods
The study area is the southwestern tip of the Primorsky Krai region of Russia, along the border with North Korea and China. This coastal region spans from about 44°N, 130°E to 42°N, 132°E. The diverse flora of the region includes tundra, coniferous-deciduous forest, and forest-steppe or grassland. While some of the oak trees are able to withstand small fires, the fires in the area have become too frequent for even the most resilient trees to survive. To examine the conversion of forest to grassland in Southwestern Primorsky Krai, several data sets are used. A time-series obtained from the FIRMS Web Fire Mapper shows all of the fires that have burned in the area from 2000 to 2010. Landsat images from 1976 and 2007 were processed by applying an NDVI to red-IR coded images, and a density slice was applied to show the results in color. SRTM elevation data were downloaded from the GLCF and can be used to evaluate the terrain. A 3D model of elevation in the area shows the shape of the coast-line. Comparisons over time are made to determine the extent of loss of forest cover.
The study area of the Landsat images and SRTM data:
View Primorsky Krai in a larger map
Results
Overall, it appears that there are a large number of forest fires in the area, and closed forest is transitioning into open grassland, which is unsuitable habitat for the Amur Leopard. Analysis of the NDVI's of the Landsat images shows that greenness (photosynthetic activity) has decreased in various areas within the study site. The areas where greenness has decreased correlate with lighter areas in the night-light image, indicating that deforestation is taking place mostly near human settlements (near the coast). Comparison with the FIRMS fire data also shows that the areas that show a loss of greenness tend to be more frequently burned than other areas. These findings are particularly disturbing when it is considered that most of the Landsat study area is within the Barsovyi Wildlife Refuge. Although the fires may not be large and destructive, their frequency prevents the forest understory from regrowing, leading to a gradual transition to grassland as the trees die out.
Imagery
The following images are of the South-western tip of the Primorsky Krai region of Russia, where the few remaining Amur Leopards reside. Click the images for a larger view. The first map shows the Amur Leopard's historic distribution (pink) and the area it is currently restricted to (red). The area covered in subsequent images is within the red section of this image:
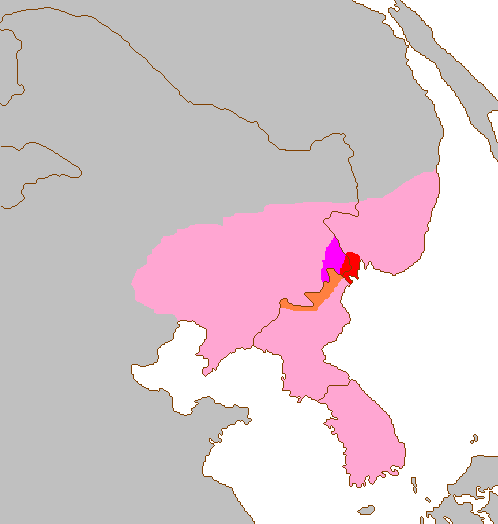
Source: Wikipedia
A subset of a 1976 Landsat image of the area:

A subset of a 2007 Landsat image of the area:

An NDVI of the 1976 Landsat image:

An NDVI of the 2007 Landsat image:

Colors, from highest to lowest NDVI Values (applies to both NDVI images)
Light green: highest NDVI value
Dark Green
Yellow
Orange
Red
Light Blue
Dark Blue: lowest NDVI value
The 2007 Landsat NDVI again. The circled areas are areas that appear significantly different from the 1976 image, and indicate possible burn scars, areas of deforestation, or areas where human settlement or agriculture has been expanded:

SRTM 90 meter resolution elevation image for the area:

A 3D Surface View of the SRTM 90 meter elevation image. A notable crevasse is visible in the western portion of the image, which shows up as a low-vegetation area in the Landsat images:

Night Light Image of the area, which roughly indicates where human settlements are:

A slideshow of fires in the area from 2001 to 2010, from the FIRMS Web Fire Mapper. Protected areas are marked in green, and orange squares mark where fires occurred. These images cover a larger area than the Landsat and SRTM.

Discussion
These findings reinforce those of ALTA's research in the area. ALTA found that areas already affected by human activity (meadows and hayfields) were much more likely to burn than other areas. This correlation between areas of human activity and higher frequency burning is clearly visible in the FIRMS slideshow.
There are limitations to this research. For example, the 1976 Landsat image is much lower quality than the 2007 image, which made them difficult to compare. There were also a few clouds in the 2007 image which can affect the analysis.
Additional research in this area is needed. Although greenness is a good measure of vegetation cover, higher resolution imagery could be analyzed to clearly distinguish forested areas from open grasslands. Analysis of forest cover could definitively show where deforestation and leopard habitat loss has occurred. ALTA also mentions that the border patrol in the area has acted as an effective fire break which stopped fires from spreading across the border zone. Part of their efforts involve creating more fire breaks to slow the spread of fires within leopard habitat. Additional research could further document the efficacy of such fire breaks, and perhaps encourage funding for their projects. ALTA is also pursuing programs to educate locals on the importance of conserving the Amur Leopard, and promoting ex-situ conservation of the species.
References
Miquelle, D. G., Murzin, A., Hötte, M. "An Analysis of Fires and Their Impact on Leopards in Southwest Primorye". TIGRIS Foundation and Wildlife Conservation Society. 2004. http://amur-leopard.org/files/document%20page/A.%20leopard%20range%20fire%20analysis%202004%20%283%20mb%29.pdf.
Pikunov, D. G., Aramilev, V. V., Fomenko, V. V., Miquelle, D. V., Abramov, V. K., Korkishko, V. G. and Nikolaev, I. G. (2000) Endangered species: The decline of the Amur leopard in the Russian Far East. Russian Conservation News 24: 19.
Uphyrkina, O. & O’Brien, S.J. (2003) Applying molecular genetic tools to the conservation and action plan for the critically endangered Far Eastern leopard (Panthera pardus orientalis). Comptes Rendus Biologies 326 (Supplement 1): 93-97.
Uphyrkina, O., Miquelle, D., Quigley, H., Driscoll, C. & O’Brien, S.J. (2002) Conservation Genetics of the Far Eastern Leopard (Panthera pardus orientalis). The Journal of Heredity 93 (5): 303-311.
Thursday, May 27, 2010
Lab 8 (week 9)

(click to enlarge)
This map shows the percentage of black people living in each county in the United States in 2000. The percentage is calculated by the number of black people in a county divided by the total number of people in that county. One major pattern is that there tends to be a higher percentage of black people living in the Southern states. There is also a slightly higher percentage in California than in many of the mid-western and northern states.

(click to enlarge)
This map shows the percentage of asian people living in each county in the United States in 2000. The percentage is calculated by the number of asian people in a county divided by the total number of people in that county. One major trend is that there tends to be a higher percentage of asian people living in coastal states. California and Washington have quite high percentages, and there is also a concentration in New York and Maryland.

(click to enlarge)
This map shows the percentage of "other race" people living in each county in the United States in 2000. The percentage is calculated by the number of "other race" people in a county divided by the total number of people in that county. A major pattern is that there tends to be a higher percentage of "other race" people living in states that border Mexico, as well as in Washington. It would make sense if "other race" includes Latinos, as it is known that there are high percentages of Hispanic and Latino Americans living in California, Texas, and New Mexico.
Concluding Discussion of Census Maps:
The census maps reveal rather clear patterns of where people of certain races tend to live. For the map of African Americans, especially, there is a clearly defined area of higher percentages of black people. I believe these maps reveal the racial segregation that occurs in the United States, either voluntarily by where people choose to live, or caused by societal pressures. If some degree of racial segregation was not occurring, these clear patterns would not emerge. Overall, the data was interesting to look at. I just hope that these patterns can be attributed to voluntary actions, and the general tendency of people within the same ethnic group to live together, rather than with those of a different ethnic group. With the differing economic success of various areas, however, it seems that there are other unfortunate factors at play.
My Overall Impressions of GIS:
GIS is obviously a powerful tool with many applications across various fields. With GIS, it is quite easy to take raw data and turn it into a clear, concise, and stylish map. I was impressed by the interface for choosing intervals for the categories and colors; it was very customizable. Since you can even make 3D graphics in ArcScene, the program seems extremely versatile. GIS can be used for spatial analysis (to get results for your study) and producing graphics (to display those results). In this way, it is a very useful device for scientists, who can complete two parts of their scientific research with one program. I'm glad I had the opportunity to work with ArcGIS, because I may use this powerful tool to conduct spatial analysis and present results in future jobs. It is quite relevant to any kind of environmental spatial analysis, such as examining which areas are impacted by pollution, finding good sites for wind-mills or solar power plants, or defining the range of endangered animals.
Thursday, May 20, 2010
Lab 7 (week 8)

(click for a larger view)
The Station Fire’s Effects on Nearby Residential Areas and Structures:
Although the Station Fire started within the Angeles National Forest, it quickly grew larger and spread into an out of control wildfire. For a while, the firefighters stated that they only had the fire 5% contained, meaning that it was nearly impossible to control where the fire was spreading to. Fortunately, the blaze was eventually brought under control, and caused only two deaths. Property damage was not very extensive, considering the size of the blaze.
The Station Fire became a threat to nearby populated areas. The second map shows how the fire spread to overlap parts of densely populated, residential zones. The firefighters attempted to set up fire breaks as a defense against the fire spreading to nearby homes. However, they were not entirely successful. The fire was extremely difficult to contain, and raged out of control for a while. Eighty nine homes were destroyed, and thirteen were damaged.
The fire also threatened commercial property. The fire burned on the slopes of Mount Wilson, where over twenty four television, cellphone, and radio towers are. Also at the top of the mountain is a historic solar observatory, worth over $20 million. The observatory is used by UCLA, USC, UC Berkeley, and Georgia State University, so it would affect many researchers if it were destroyed. There was much concern over the expensive equipment in the observatories (which could not be moved easily), but the firefighters’ efforts to protect the area were successful. Only two communication sites were destroyed.
Several roads were closed due to the station fire, likely interfering with the daily life of residents in the area. Perhaps the most notable closure was the Angeles Crest Highway, which runs directly through the center of the fire’s area, and is usually used by 11,300 motorists each day. Eleven other roads were closed for the fire’s duration. Also, many residents had to be evacuated in ares such as Juniper Hills, La Crescenta, La Canada Flintridge, Altadena, Tujunga, Glendale, and Sunland.
Large fires like the Station Fire in California are an unfortunate result of historic fire suppression. The mediterranean climate has many natural fires, which the native flora are adapted to, or even dependent on. Since European settlement, natural fires have not been allowed to gradually burn up the “fuel” of plant litter that accumulates on forest floors. The result is that when fires do occur and get out of hand, they become large crown fires which kill trees that would otherwise survive them. Disrupting the natural system of small, frequent fires has created a hazard to the environment and to the residents of California.
References:
"20 Largest California Wildland Fires (By Acreage Burned)". California Department of Forestry and Fire Protection. September 3, 2009. http://www.fire.ca.gov/communications/downloads/fact_sheets/20LACRES.pdf
Knoll, Corina. “TV, cellphone signals from Mt. Wilson at risk.” Los Angeles Times. 31 August 2009. http://articles.latimes.com/2009/aug/31/local/me-fire-mount-wilson31
"Station Fire Evening Update Aug. 31, 2009". InciWeb (United States Forest Service). August 31, 2009. http://inciweb.org/incident/article/9360/
“Station Fire Update Sept. 27, 2009”. InciWeb. September 27, 2009. http://inciweb.org/incident/article/9640/
Weikel, Dan. “Angeles Crest Highway closed indefinitely because of fire”. Los Angeles Times. 4 September 2009. http://latimesblogs.latimes.com/lanow/2009/09/angeles-crest-highway-closed-indefinitely-because-of-fire.html
Subscribe to:
Posts (Atom)